March 19, 2018 in San Juan, Puerto Rico – In the last few years we have experienced a number of extreme weather events throughout the Puerto Rican archipelago. The most recent ones were hurricanes Irma and María, which caused extensive agricultural devastation resulting in approximately $2.08 billion in losses. However, there was a phenomenon which severely affected Puerto Rican agriculture prior to the 2017 hurricanes—the 2014-16 drought.
Little research has been conducted on this phenomenon, especially in Puerto Rico, given the susceptibility of tropical crops to climate change and the vulnerability of the tropics to water scarcity and high temperatures.
Furthermore, agricultural losses resulting from the 2014-16 drought, which affected the entire island, totaled over $13 million according to preliminary reports from the United States Department of Agriculture in 2015.
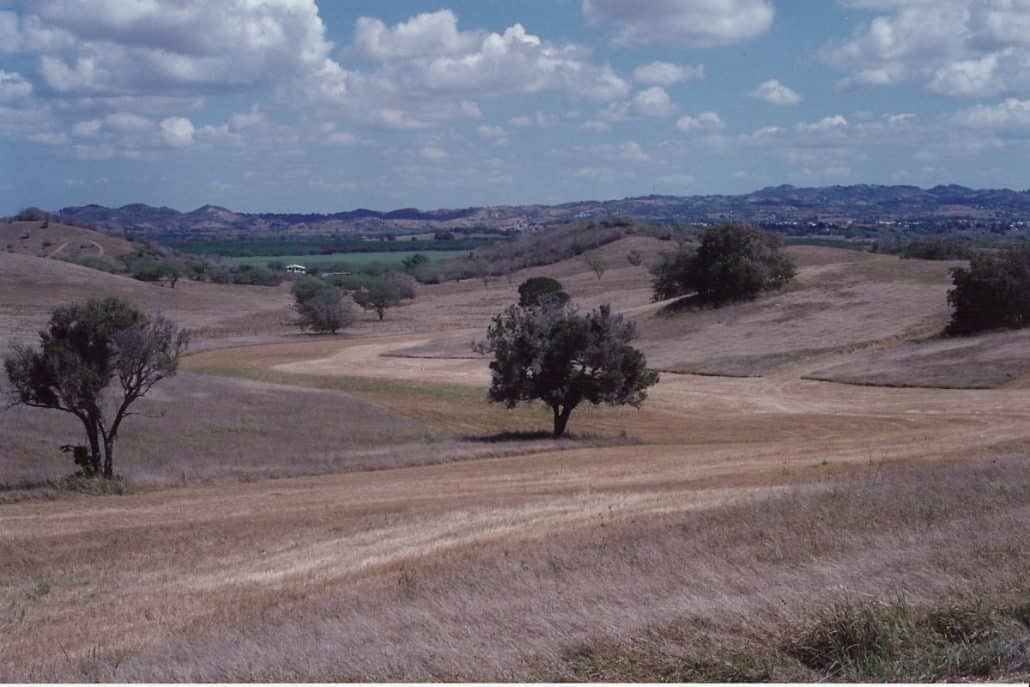
Agricultural area affected by drought in Lajas, Puerto Rico, photo by Samuel Ríos of NRCS.
Drought is defined as a reduction in precipitation over an extended period that can be aggravated by high temperatures, high winds, and low relative humidity. During this phenomenon soil moisture can decrease rapidly, affecting crop health and yield, especially in tropical areas which are largely dependent on rain or stored rainfall for irrigation.
“Drought is a phenomenon which is overlooked and is probably the least studied of the natural hazards,” warned environmental scientist Dr. Nora Álvarez, regarding the need for this type of research and planning to address this phenomenon in Puerto Rico.
Given the ever greater possibility of an event like this occurring again, it is imperative that we take conservation measures to mitigate the effects of climate change on natural resources and its economic consequences on agriculture.
Recently, a study published in the Cambridge University journal Renewable Agriculture and Food Systems, titled “Correlating drought conservation practices and drought vulnerability in a tropical agricultural system,” revealed the divergences between the application of drought mitigation and conservation practices and the areas most susceptible to this phenomenon.
The study, conducted by the USDA’s Caribbean Climate Hub, was led by Dr. Álvarez Berríos and a group of experts on cartography analysis, including Dr. Sandra Soto Bayó, Eva Holupchinski, Stephen J. Fain, and Dr. William A. Gould.
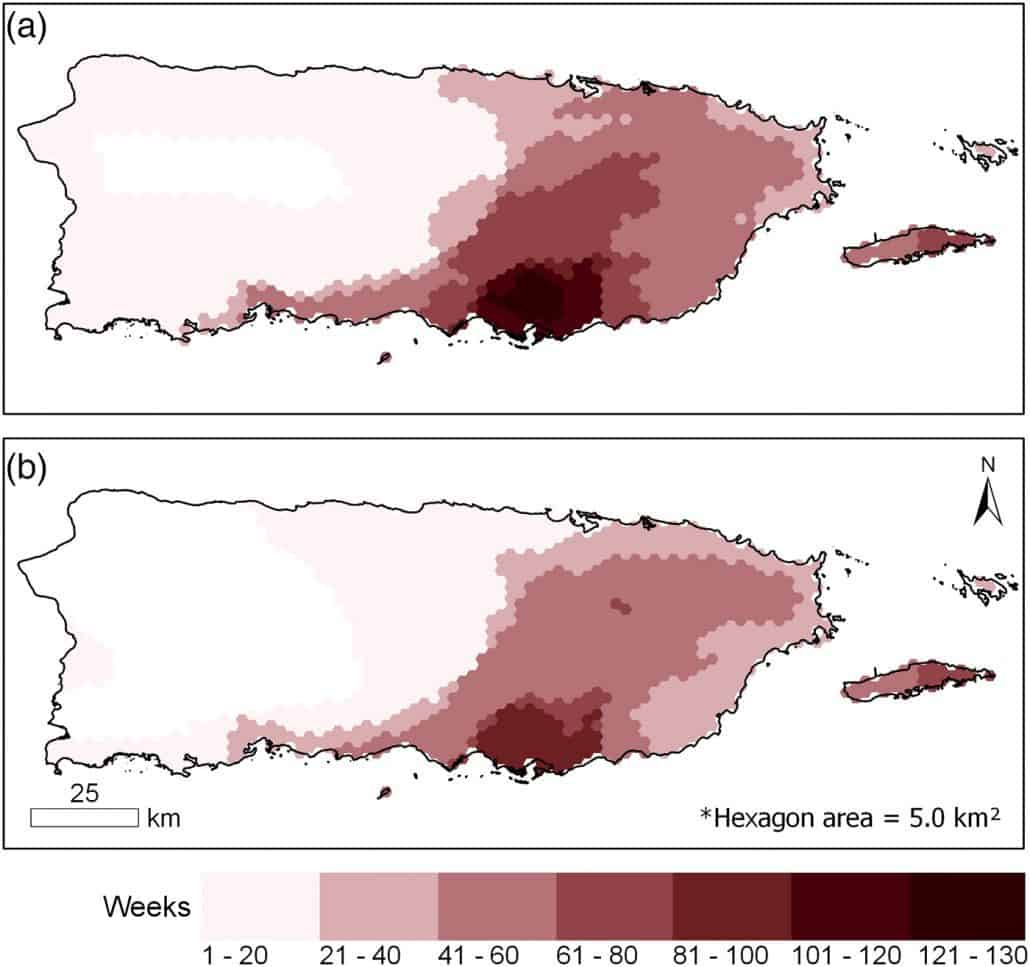
The results of the study indicate that there were 7 recorded drought episodes from 2000 to 2016, the most severe of which occurred between 2014 and 2016. During this period, the island experienced 80 consecutive weeks of moderate drought, 48 weeks of severe drought, and 33 weeks of extreme drought conditions. The areas most affected by the 2014-16 drought were the eastern and southeastern parts of the main island and the islands of Vieques and Culebra, where severe to extreme drought conditions were also recorded.
The data was collected using maps from the US Drought Monitor, developed with the National Drought Mitigation Center (NDMC) at the University of Nebraska-Lincoln, which portray recorded drought conditions in areas of the US and Puerto Rico.
Based on these findings the researchers identified the regions on the island where the USDA Natural Resources Conservation Service (NRCS) had established agricultural conservation practices for drought adaptability and risk mitigation in order to determine if they coincided with the areas where they would be needed the most.
The selection of the adaptability practices was based on their valuation in the NRCS Conservation Practices Physical Effects (CPPE) tool. The selected practices had a score higher than 2 on the CPPE ranking system which assigns a relative value based on their impact on (1) water availability, including water management for irrigation and soil moisture; (2) plant health, which focuses on practices that improve crop strength and yield; and (3) practices that contribute to soil quality and which minimize erosion (see Appendix 1).
The study revealed that between 2000 and 2016, 76% of these adaptability practices were concentrated in regions with at least one week of moderate drought, 19% in areas of severe drought, and only 7% in places of extreme drought.
One of the goals of the study was to identify the areas in Puerto Rico most vulnerable to drought and to promote conservation and risk mitigation practices that can help minimize the impact of this climate event on the local agriculture.
The data reveal that the agriculture regions that are most exposed to drought are the ones that least employ conservation techniques to mitigate it. The reason for this disparity is the short duration and extent of the drought in relation to the short time that has passed since the phenomenon, which has left little room for an in-depth study of the patterns of conservation practices throughout Puerto Rico.
Moreover, the study takes into consideration future drought projections and the analysis concludes that the same areas that were vulnerable to droughts during recent years will be severely affected by these conditions in the future. The Caribbean Climate Hub, in its mission of communicating the risks associated with extreme climate events and promoting adaptation and mitigation strategies, advises farmers and farm owners to take these practices into consideration in order to reduce their vulnerability to these events and, in doing so, create a resilient agricultural future for Puerto Rico.
REFERENCE: Álvarez-Berríos, N., Soto-Bayó, S., Holupchinski, E., Fain, S., & Gould, W. (2018). Correlating drought conservation practices and drought vulnerability in a tropical agricultural system. Renewable Agriculture and Food Systems, 1-13. doi:10.1017/S174217051800011X
Maps of the number of non-consecutive weeks under drought conditions during the periods: (a) 2000 to 2016 and (b) 2014 to 2016. The maps were created based on US Drought Monitor weekly drought reports (NDMC, 2017).
ANNEX 1:


Follow Us!